Analytics Reference Manager Dashboard
The Reference Manager dashboard displays information on the daily mechanics of running and managing a reference program, such as:
- Reference request fulfillment
- Reference nomination processing
- Managing reference customer info
- Managing available reference content
- Managing reference recruitment and pipeline
Note: When a filter is applied, a header with the number of fields that were filtered appears on the dashboard. For more information on filters, see Apply an On-Page Filter - Dashboard.
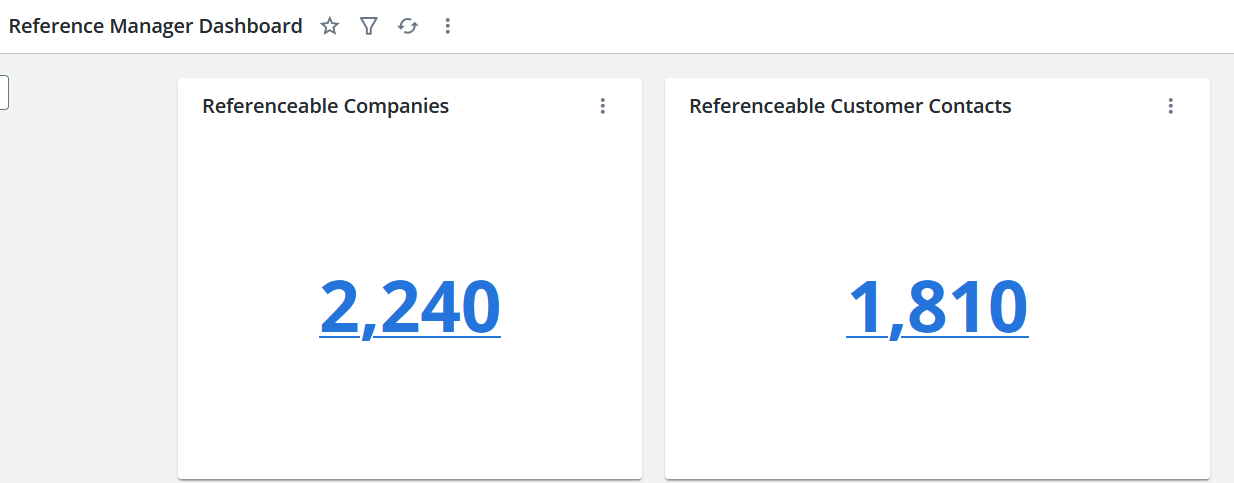
Key Performance Indicators
Referenceable Companies
Total number of referenceable companies, defined in the system as currently active (not deactivated).
Referenceable Customer Contacts
Total number of customer contacts that are willing to participate in at least 1 reference activity.
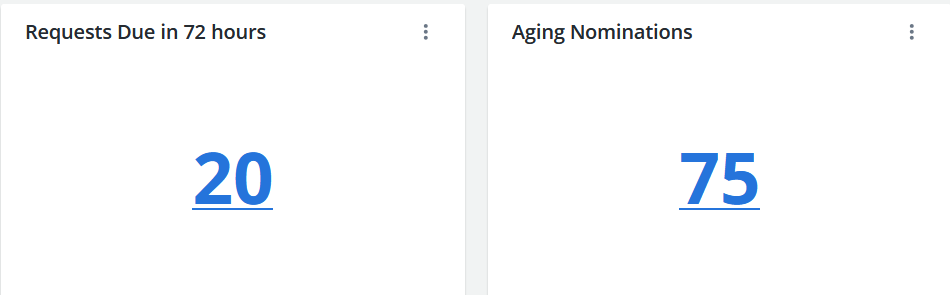
Requests Due in 72 Hours
Total number of open reference requests that have a deadline date within 72 hours. This KPI drills down to a report listing the open reference requests.
Aging Nominations
Total number of aging nominations by submission date ( >7 days from submission).
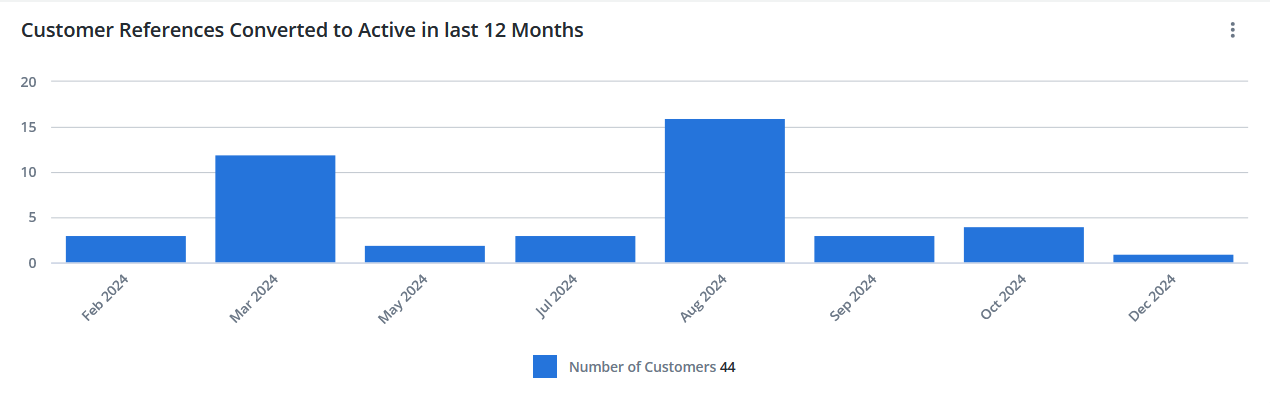
Customer References Converted to Active in Last 12 Months
The Customer References Converted to Active chart shows all customer references converted from "Recruited" to "Active" in the last 12 months (including the current month). Only new customers that are converted are included in this chart. This graph drills down to a tabular report showing the list of converted customer references.
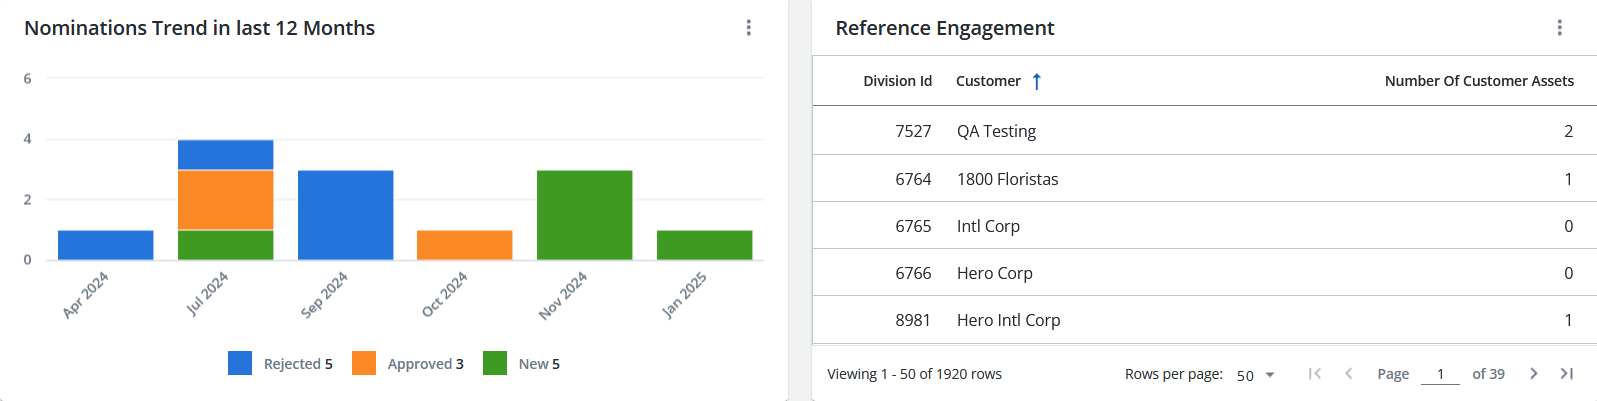
Nominations Trend in Last 12 Months
The Nominations Trend chart shows a monthly breakdown of "Approved," "In Progress," "Not Approved," "New," and "Draft" nominations in the last 12 months (including the current month). This chart drills down to a tabular report showing additional detail related to the nominations.
Reference Engagement
The Reference Engagement chart shows an in depth reporting of reference customer names, number of referenceable contacts, and total number of reference activities.
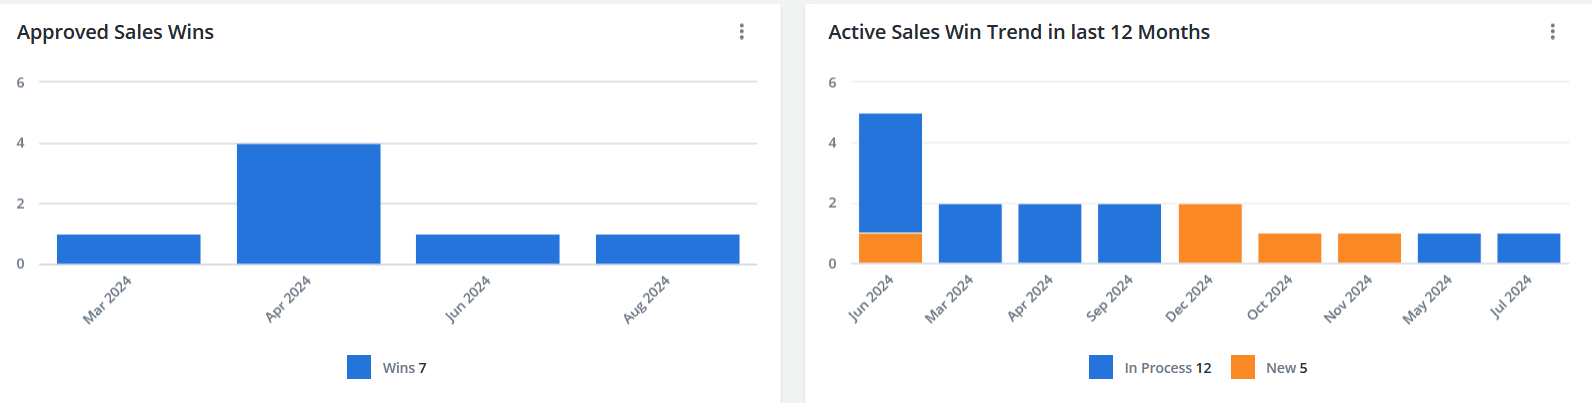
Approved Sales Wins
The Approved Sales Wins chart shows a monthly breakdown of approved sales wins in the last 12 months (including the current month). This chart drills down to a tabular report showing additional detail around the approved sales wins.
Active Sales Win Trend in Last 12 Months
The Active Sales Win Trend chart shows a monthly breakdown of "Draft," "In Process," and "New" submitted sales wins in the last 12 months (including the current month). This chart drills down to a tabular report showing additional detail around the submitted sales wins.
Note: The Upland RO Innovation Help Center has information on Upland RO Innovation standard dashboards, fields, sources, and related events. To learn more about working with the dashboards and reports, see the Upland Analytics Help Center.